Currency
 AED
AED
 AFN
AFN
 ALL
ALL
 AMD
AMD
 ANG
ANG
 AUD
AUD
 AWG
AWG
 AZN
AZN
 BAM
BAM
 BBD
BBD
 BDT
BDT
 BIF
BIF
 BND
BND
 BOB
BOB
 BSD
BSD
 BWP
BWP
 BZD
BZD
 CAD
CAD
 CDF
CDF
 CHF
CHF
 CRC
CRC
 CVE
CVE
 CZK
CZK
 DJF
DJF
 DKK
DKK
 DOP
DOP
 DZD
DZD
 EGP
EGP
 ETB
ETB
 EUR
EUR
 FJD
FJD
 FKP
FKP
 GBP
GBP
 GMD
GMD
 GNF
GNF
 GTQ
GTQ
 GYD
GYD
 HNL
HNL
 HUF
HUF
 IDR
IDR
 ILS
ILS
 INR
INR
 ISK
ISK
 JMD
JMD
 JPY
JPY
 KES
KES
 KGS
KGS
 KHR
KHR
 KMF
KMF
 KRW
KRW
 KYD
KYD
 KZT
KZT
 LAK
LAK
 LBP
LBP
 LKR
LKR
 MAD
MAD
 MDL
MDL
 MKD
MKD
 MMK
MMK
 MNT
MNT
 MUR
MUR
 MVR
MVR
 MWK
MWK
 MYR
MYR
 NGN
NGN
 NIO
NIO
 NPR
NPR
 NZD
NZD
 PEN
PEN
 PGK
PGK
 PHP
PHP
 PKR
PKR
 PLN
PLN
 PYG
PYG
 QAR
QAR
 RON
RON
 RSD
RSD
 RWF
RWF
 SAR
SAR
 SBD
SBD
 SEK
SEK
 SGD
SGD
 SHP
SHP
 SLL
SLL
 STD
STD
 THB
THB
 TJS
TJS
 TOP
TOP
 TTD
TTD
 TZS
TZS
 UAH
UAH
 UGX
UGX
 USD
USD
 UYU
UYU
 UZS
UZS
 VND
VND
 VUV
VUV
 WST
WST
 XAF
XAF
 XCD
XOF
XPF
XCD
XOF
XPF
 YER
YER



Description
x
Dive Deeper Into the Company’s Strategic Blueprint
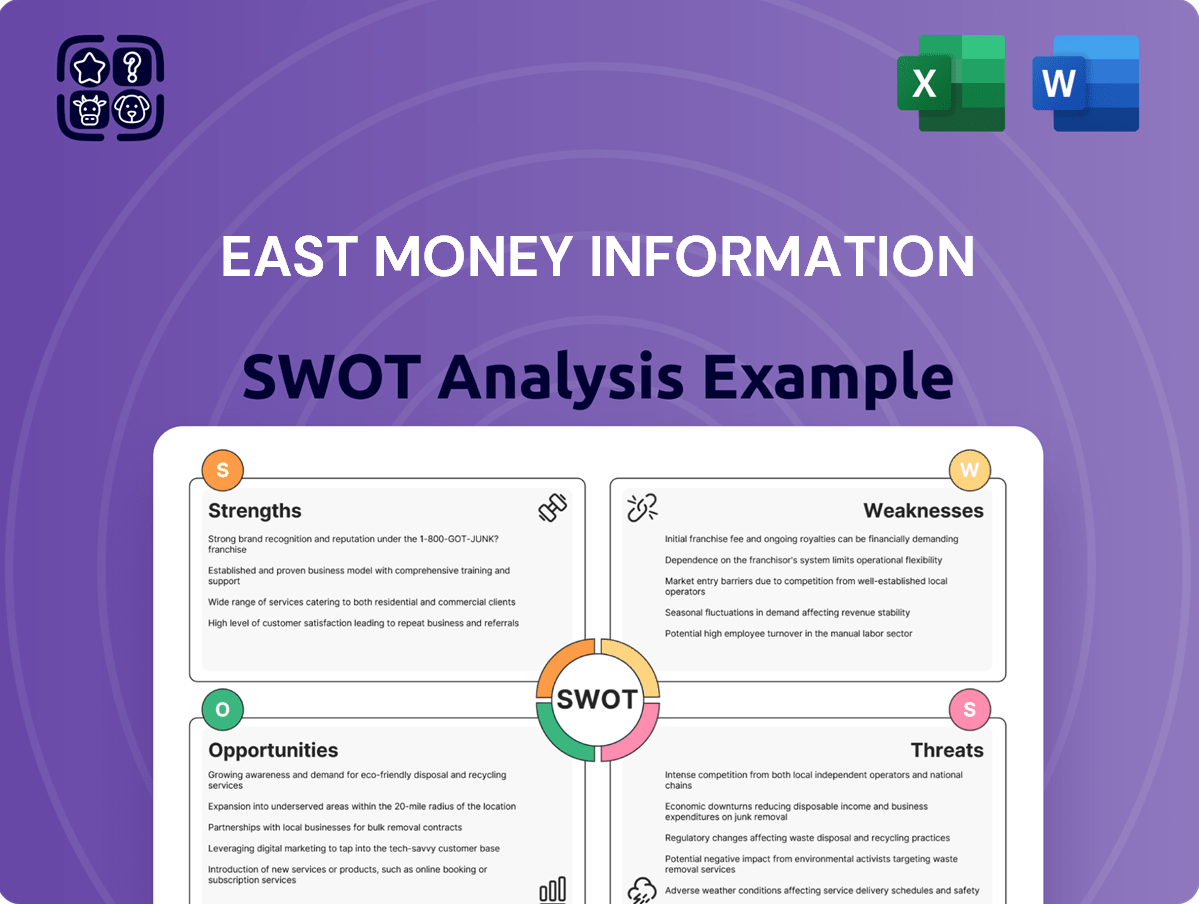
East Money Information’s SWOT highlights robust market reach and innovative data products but also flags regulatory exposure and competitive pressure; our full SWOT unpacks these factors with financial context and strategic implications. Purchase the complete analysis to receive a professionally formatted, editable Word and Excel package—ideal for investors, analysts, and strategists who need actionable, research-backed insights.
Strengths

Dominant Digital Traffic Ecosystem
East Money operates one of China’s largest financial portals and apps, drawing about 200 million monthly active users as of Dec 2025, creating a self-sustaining traffic ecosystem that feeds its brokerage and wealth-management funnel.
This massive audience drives client acquisition: in 2024 East Money reported over 12 million brokerage accounts and Rmb1.2 trillion assets under management, ensuring steady active-user flow.
By integrating real-time news, community forums, and trading tools in-app, East Money achieves higher user stickiness than many traditional banks and brokers, with average daily use above 30 minutes per active user.
Low Customer Acquisition Costs
East Money leverages internet-native distribution to convert content users into brokerage and fund clients at much lower spend than traditional brokers—its 2025 cost-to-income ratio was about 18%, versus ~30–40% for legacy peers, boosting operating margins to roughly 32% in FY2024.

Integrated Financial Service Model
East Money has bridged info and transactions via a broad license set, letting users research and trade without leaving its apps; in 2024 the group reported 300m MAUs and direct brokerage assets of RMB 1.2 trillion, boosting take-rates across the funnel. This vertical integration cuts onboarding friction, raises conversion from content to trade, and captures more retail value-chain revenue—helping propel 2024 brokerage revenues up ~18% year-on-year.

Market Leadership in Fund Distribution
- 220+ billion RMB AUM (2024)
- 18 million users (2024)
- Wide product selection; strong fee negotiation leverage
Scalable Technology Infrastructure
East Money's digital-first model scales rapidly without branch costs, supporting 2024 active users of 67.2 million and 2024 revenue growth of 16% year-over-year (HKD basis).
Ongoing cloud and data investments handle peak trading spikes—platform processed a record 3.8 million orders per minute during Jan 2024 market volatility—keeping uptime above 99.95%.
This tech agility cuts latency, preserves service reliability, and speeds new product launches like wealth-management APIs rolled out in Q3 2024.
- 67.2m active users (2024)
- Revenue +16% YoY (2024)
- 3.8m orders/min peak (Jan 2024)
- Uptime >99.95%
- Wealth APIs launched Q3 2024
East Money: Massive scale—200–300M MAU, RMB1.2T AUM, 32% margin
East Money’s scale: ~200–300m MAU (Dec 2025), 12m+ brokerage accounts, RMB1.2t brokerage AUM (2024), Tiantian Fund RMB220b AUM (2024) and 18m users; FY2024 operating margin ~32%, cost-to-income ~18%; 67.2m active users and +16% revenue YoY (2024); peak 3.8m orders/min (Jan 2024), uptime >99.95%.
| Metric | Value |
|---|---|
| MAU (Dec 2025) | 200–300m |
| Brokerage AUM (2024) | RMB1.2t |
| Tiantian AUM (2024) | RMB220b |
| Operating margin (FY2024) | ~32% |
What is included in the product
 Detailed Word Document
Provides a clear SWOT framework analyzing East Money Information’s internal strengths and weaknesses alongside external opportunities and threats to assess its competitive position and strategic risks.

 Customizable Excel Spreadsheet
Delivers a concise SWOT snapshot of East Money Information for rapid strategic alignment, easing presentation prep and executive briefings with a clean, editable format that updates quickly as market conditions change.
Weaknesses

High Sensitivity to Market Volatility
The company’s revenue is tightly linked to Chinese equity market activity: in 2023 East Money Information Co., Ltd. reported brokerage and fund-distribution-related revenues that fell 28% year-over-year during the H2 2022 market slump, and daily trading volume declines of 35% in weak months cut commissions and sales fees sharply, causing pronounced quarterly earnings swings.
Geographic Concentration in Mainland China
Despite a leading 2024 domestic market share—East Money Information Co., Ltd. (SZ: 300059) served ~120 million users—the firm has minimal overseas revenue, leaving it exposed to Mainland China macro shocks and regulatory shifts that drove a 2021–2023 EPS swing of over 40%.
The company’s revenue remains >95% China-based, so policy moves (e.g., 2023 fintech rules) and GDP fluctuations directly affect earnings and valuation.
Cross-border expansion is hard: varying licensing, data rules, and entrenched local rivals in APAC and Europe have kept overseas revenue under 5% as of FY2024, limiting geographic diversification.

Underpenetration in High-Net-Worth Segments

Regulatory Compliance Burden
As a leading fintech, East Money faces heavy regulatory scrutiny from Chinese agencies on data security and capital rules; in 2024 China’s Cyberspace Administration issued guidelines raising compliance costs for online brokers.
Keeping up with fast-changing internet finance rules forces ongoing ops changes and legal spending—East Money reported selling, general and admin expenses of RMB 4.2 billion in FY2023, reflecting higher compliance outlays.
Failure to meet new standards risks fines, license limits, or product restrictions; regulators fined peer firms over RMB 500 million in 2022–24, showing real enforcement risk.
- High scrutiny: national cyber/data rules 2024
- Rising costs: SG&A RMB 4.2bn FY2023
- Enforcement precedent: peer fines >RMB 500m (2022–24)
Dependence on Retail Investor Sentiment
The business model depends heavily on retail investor activity, which is erratic and trend-driven; China’s retail account openings fell 12% in 2024 vs 2023, raising volatility in East Money’s user metrics.
If retail sentiment shifts from equities to bonds or crypto, platform trading volume and subscription uptake can drop quickly—East Money’s Q4 2024 trading-linked revenue represented ~48% of total service fees.
This reliance makes growth less predictable than peers with institutional clients; institutional revenue typically shows 30–60% lower quarter-to-quarter variance.
- Retail-driven: user activity volatile (–12% new accounts 2024)
- Revenue concentration: ~48% from trading-linked fees Q4 2024
- Growth risk: higher variance vs institutional-heavy peers (30–60% less volatility)
China-concentrated broker: trading fees, regulatory drag, shrinking retail growth
Revenue tied to China markets—trading-linked fees ~48% (Q4 2024); >95% China revenue; overseas <5% (FY2024). High regulatory cost: SG&A RMB 4.2bn (FY2023); peer fines >RMB 500m (2022–24). Retail exposure: new accounts –12% (2024) → earnings volatility; HNW underpenetration <2% of users versus RMB 80tn HNW pool.
| Metric | Value |
|---|---|
| Trading-linked fees | ~48% Q4 2024 |
| China revenue | >95% FY2024 |
| Overseas revenue | <5% FY2024 |
| SG&A | RMB 4.2bn FY2023 |
| New accounts | -12% 2024 |
Preview the Actual Deliverable
East Money Information SWOT Analysis
This is the actual SWOT analysis document you’ll receive upon purchase—no surprises, just professional quality. The preview below is taken directly from the full report you'll get; purchase unlocks the entire in-depth, editable version. You’re viewing a live preview of the real file, structured and ready to use, with the complete content available immediately after checkout.

- Choosing a selection results in a full page refresh.